Grim. California wildfires, by the numbers….
The Public Policy Institute of California (PPIC) has updated Cal Fire records to account for the Rough, Valley, and Butte Fires. The online Sacramento Bee states:
The Rough fire in Fresno County makes the all-time top 20 list for acres burned, while the Valley fire in Lake County and Butte fire in Amador and Calaveras counties make the top 10 for most destructive.
Finally on Thursday, the Butte fire, which started Sept. 9, was completely extinguished, but not before burning nearly 71,000 acres, killing two people, injuring one and destroying more than 800 structures.
As of Thursday night, Cal Fire reported that the Valley blaze, which began Sept. 12, was 97 percent contained at about 76,000 acres. It killed four civilians, injured four firefighters and destroyed nearly 2,000 structures.
And guess what! Fire season is not over yet! At this time of year, the biggest fire threat moves to Southern California, because of increasing Santa Ana winds. PPIC states that it is no coincidence that “…two of the three largest fires on record – the Rush fire in 2012 in Lassen County and the Rim fire in Tuolumne in 2013 – have occurred since the drought started in 2012.”
CalFire says that through Sept. 26 it has responded to 5,500 wildfires this year that consumed more than 305,000 acres. That compares to a five-year average of 3,850 fires and 107,000 acres.
The worsening fire seasons have sparked deeper debates about how best to prevent wildfires in the era of drought and climate change. Some researchers say the Forest Service should allow smaller fires to burn out more often, consuming dry brush and other fuel, to prevent bigger ones. PPIC also blames poor forest management practices for bigger fires.
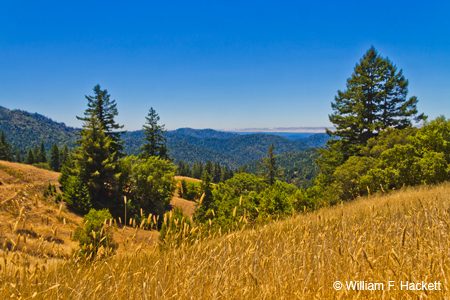
Interestingly, RAIN is not always a GOOD thing. Storms that California experienced last December spurred the growth of wild grasses. When drought conditions returned in January, the new growth dried out and became new fuel for fires, by March!
There is also intense debate about how to PAY for wildfires, if increased (and larger) wildfires are the way it’s going to be. Some say that fires should be treated like other natural disasters, using emergency money and devoting regular money to wildfire prevention.
California’s most destructive wildfires:
- 1. Tunnel-Oakland Hills (Alameda County, 1991): 25 deaths, 2,900 structures destroyed
- 2. Cedar (San Diego County, 2003): 15 deaths, 2,820 structures
- 3. Valley (Lake, Napa, Sonoma counties, 2015): 4 deaths, 1,958 structures
- 4. Witch (San Diego County, 2007): 2 deaths, 1,650 structures
- 5. Old (San Bernardino County, 2003): 6 deaths, 1,003 structures
- 6. Jones (Shasta County, 1999): 1 death, 954 structures
- 7. Butte (Amador, Calaveras counties, 2015): 2 deaths, 818 structures
- 8. Paint (Santa Barbara County, 1990): 1 death, 641 structures
- 9. Fountain (Shasta, 1992): 636 structures
- 10. Sayre (Los Angeles County, 2008): 604 structures
Cheshire Cat Photo™ – “Your Guide to California’s Wonderland™”
You can view higher-resolution photos at the Cheshire Cat Photo Gallery on SmugMug, where you can also order prints in a HUGE variety of sizes and types, even on canvas and metal! The Cheshire Cat Photo Store on Zazzle® contains a wide variety of apparel and gifts decorated with our images of California. All locations are accessible from here. LIKE Cheshire Cat Photo on Facebook here! If you don’t see what you want or would be on our email list for updates, send us an email at info@cheshirecatphoto.com. Follow us on Twitter at @cheshirkat and on Instagram at: cheshirkat


